With server monitoring services, you can know how your website is running and when you are online. When there is a problem with the server, you can be notified as soon as possible. Personal website operation and maintenance need these services to ensure stability. However, many of these services are enterprise-oriented, making them expensive and not using the functionality they provide. This article recommends several free server monitoring services to webmasters.
Uptime Monitoring Service
StatusCake
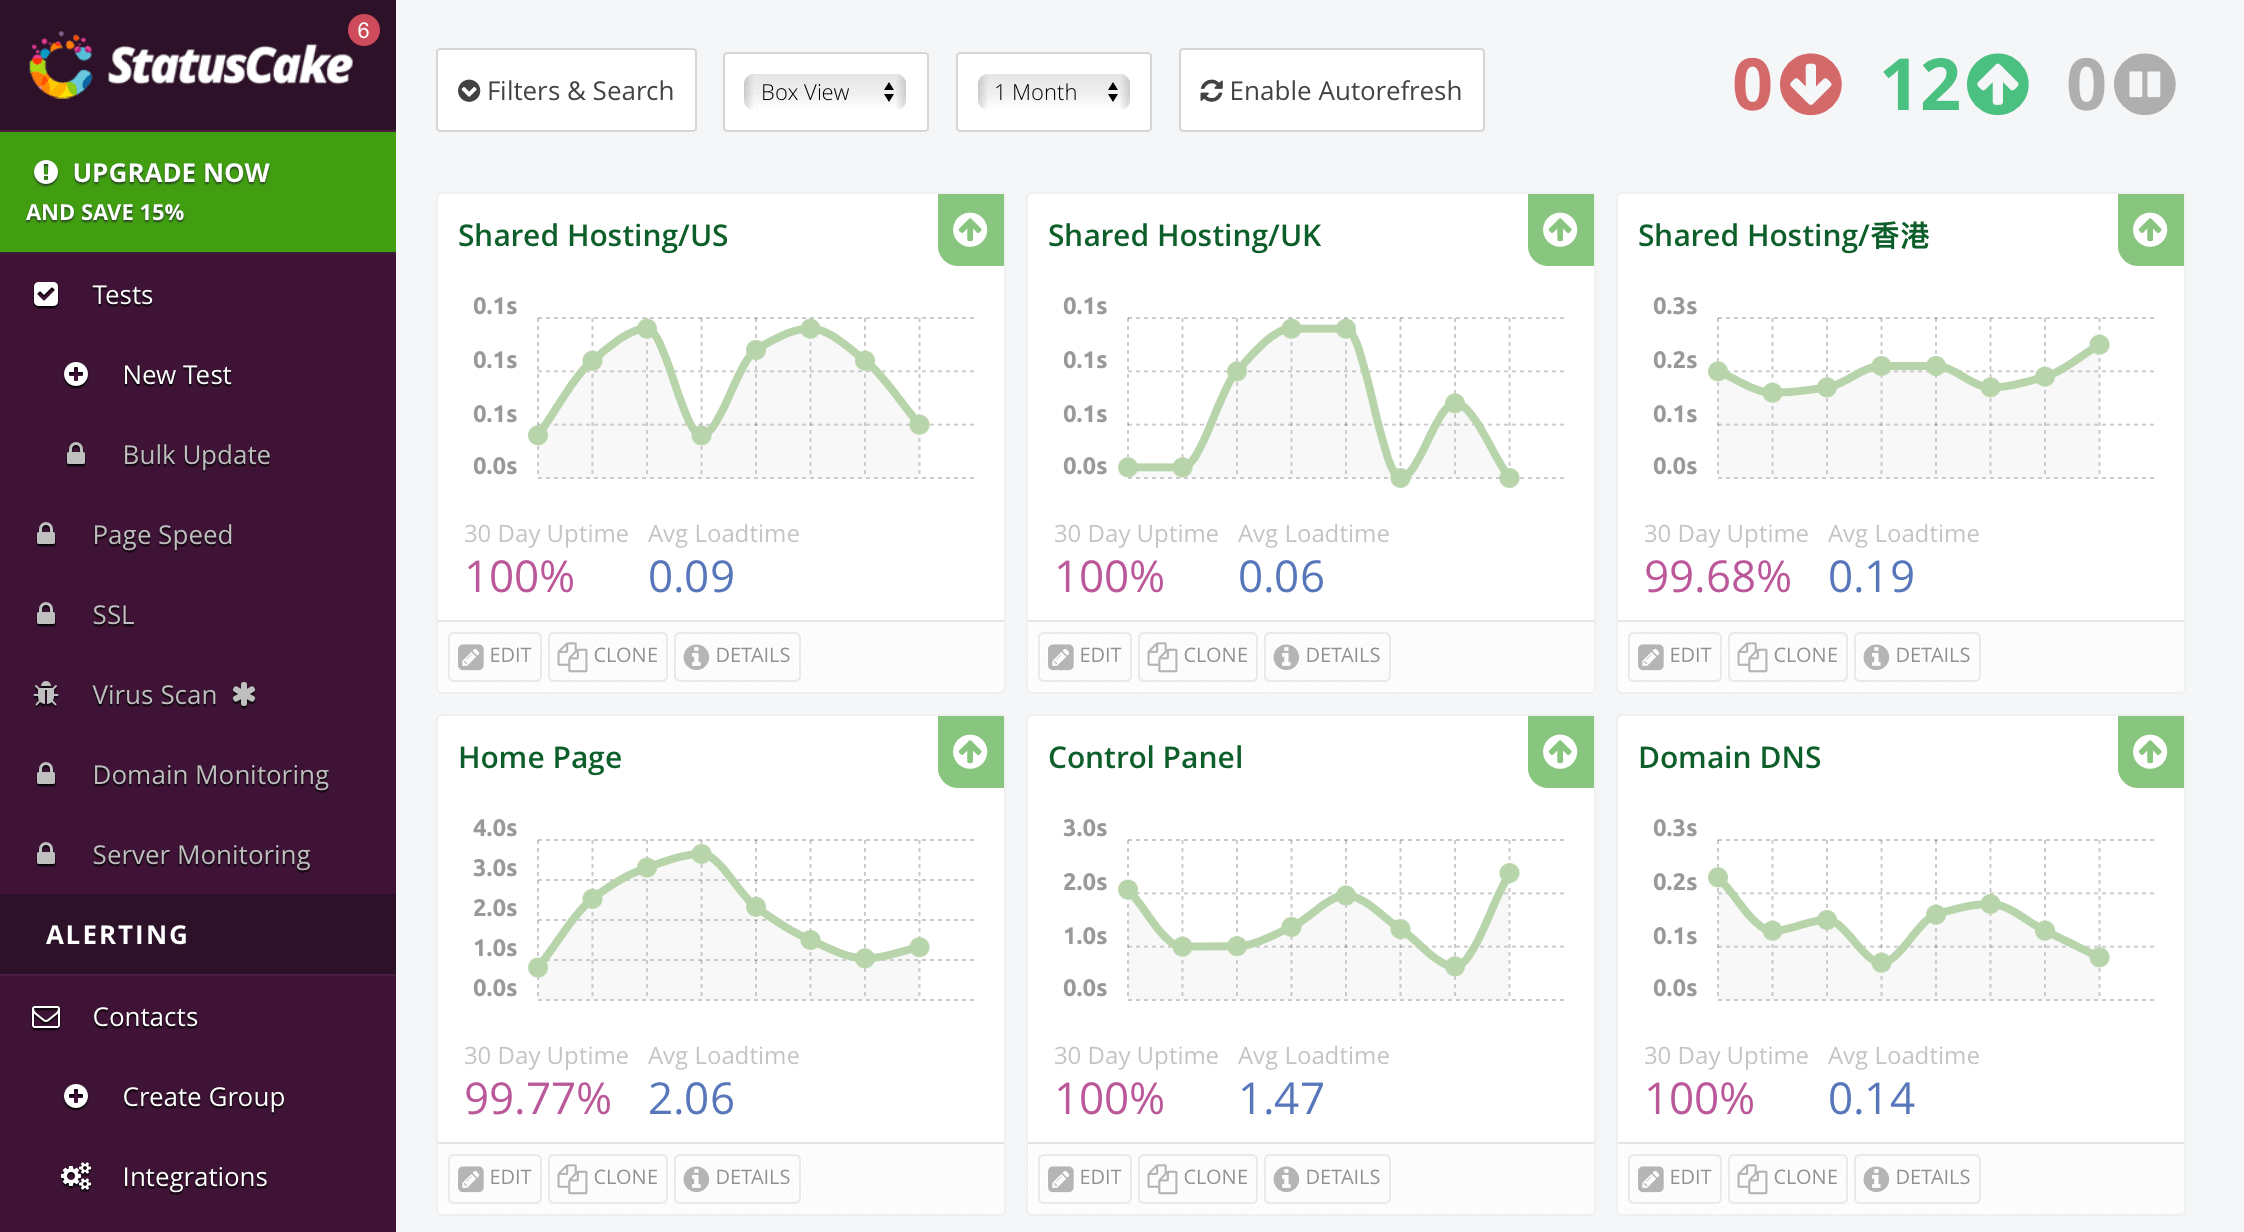
StatusCake offers both free and paid monitoring services. The free version can create an unlimited number of HTTP(s), TCP, DNS, SMTP, SSH, Ping and Push protocol monitoring. The shortest monitoring period is 5 minutes. The reminder mainly supports E-mail and Webhook. The free version does not support monitoring server configuration information, so there is no need to install any software on the server.

In addition, StatusCake supports Public Reporting, you can use StatusCake to build a monitoring page. It also supports embedding online rate images and web pages in your own web pages, which is very convenient.
UptimeRobot
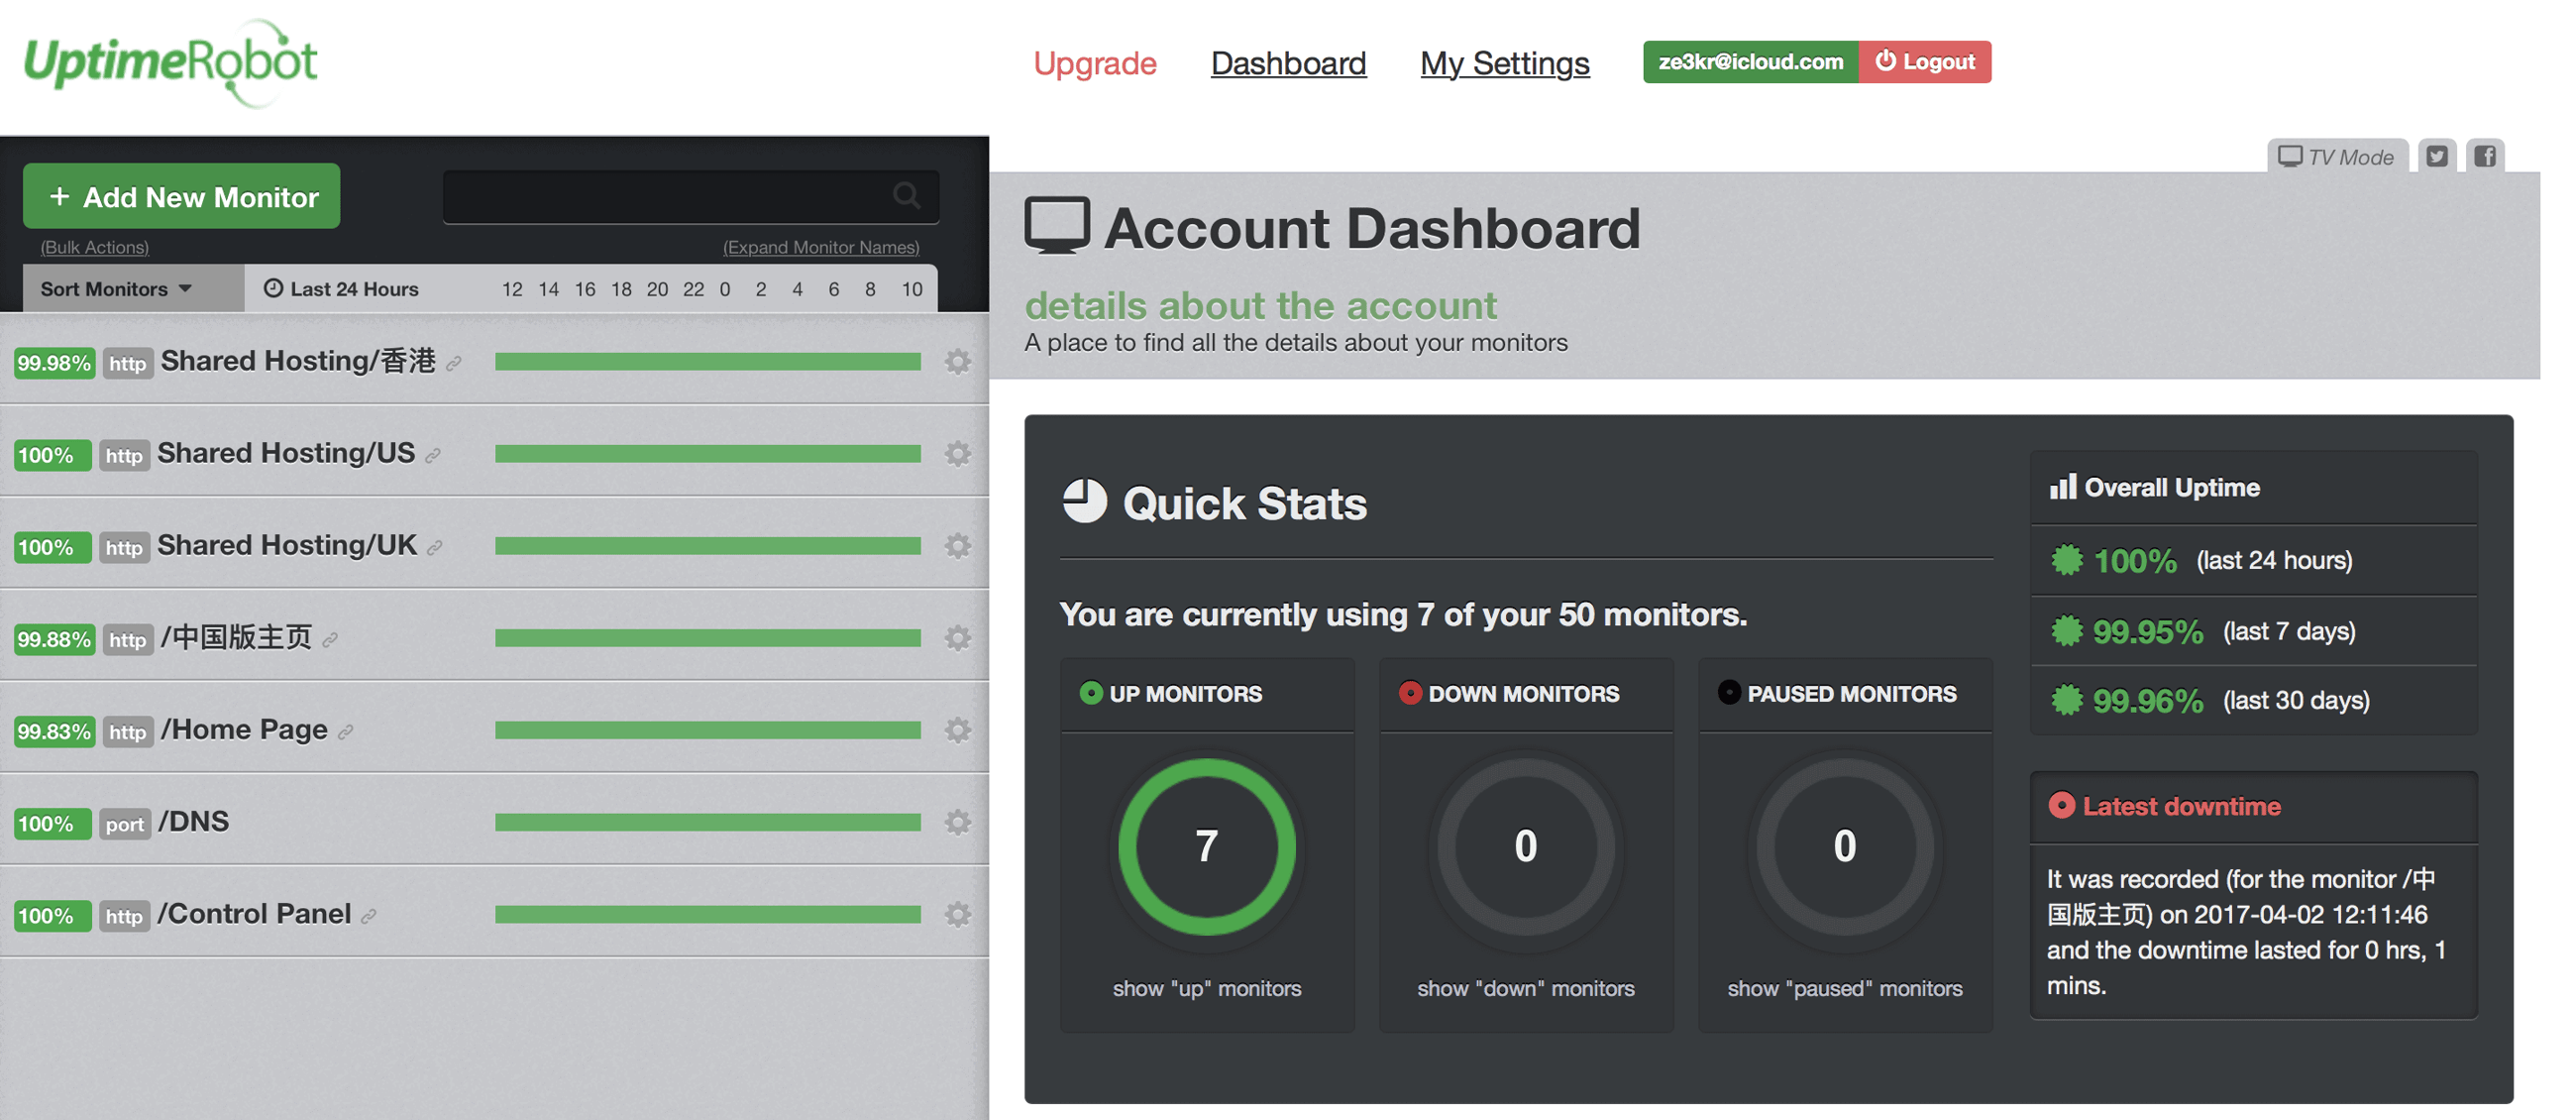
UptimeRobot also provides free monitoring services, supports HTTP(s), port detection, and Ping, and the monitoring period is as short as 5 minutes. There is also no support for monitoring server configuration information, so there is no need to install any software on the server. A maximum of 50 monitors can be created, and E-mail reminders are supported.

Compared to StatusCake, it has less monitoring features, but the Public Reporting page is a bit prettier. Since many of the features of StatusCake are hardly used by individual webmasters, UptimeRobot is also a good alternative to StatusCake.
Server metrics monitoring service
Stackdriver
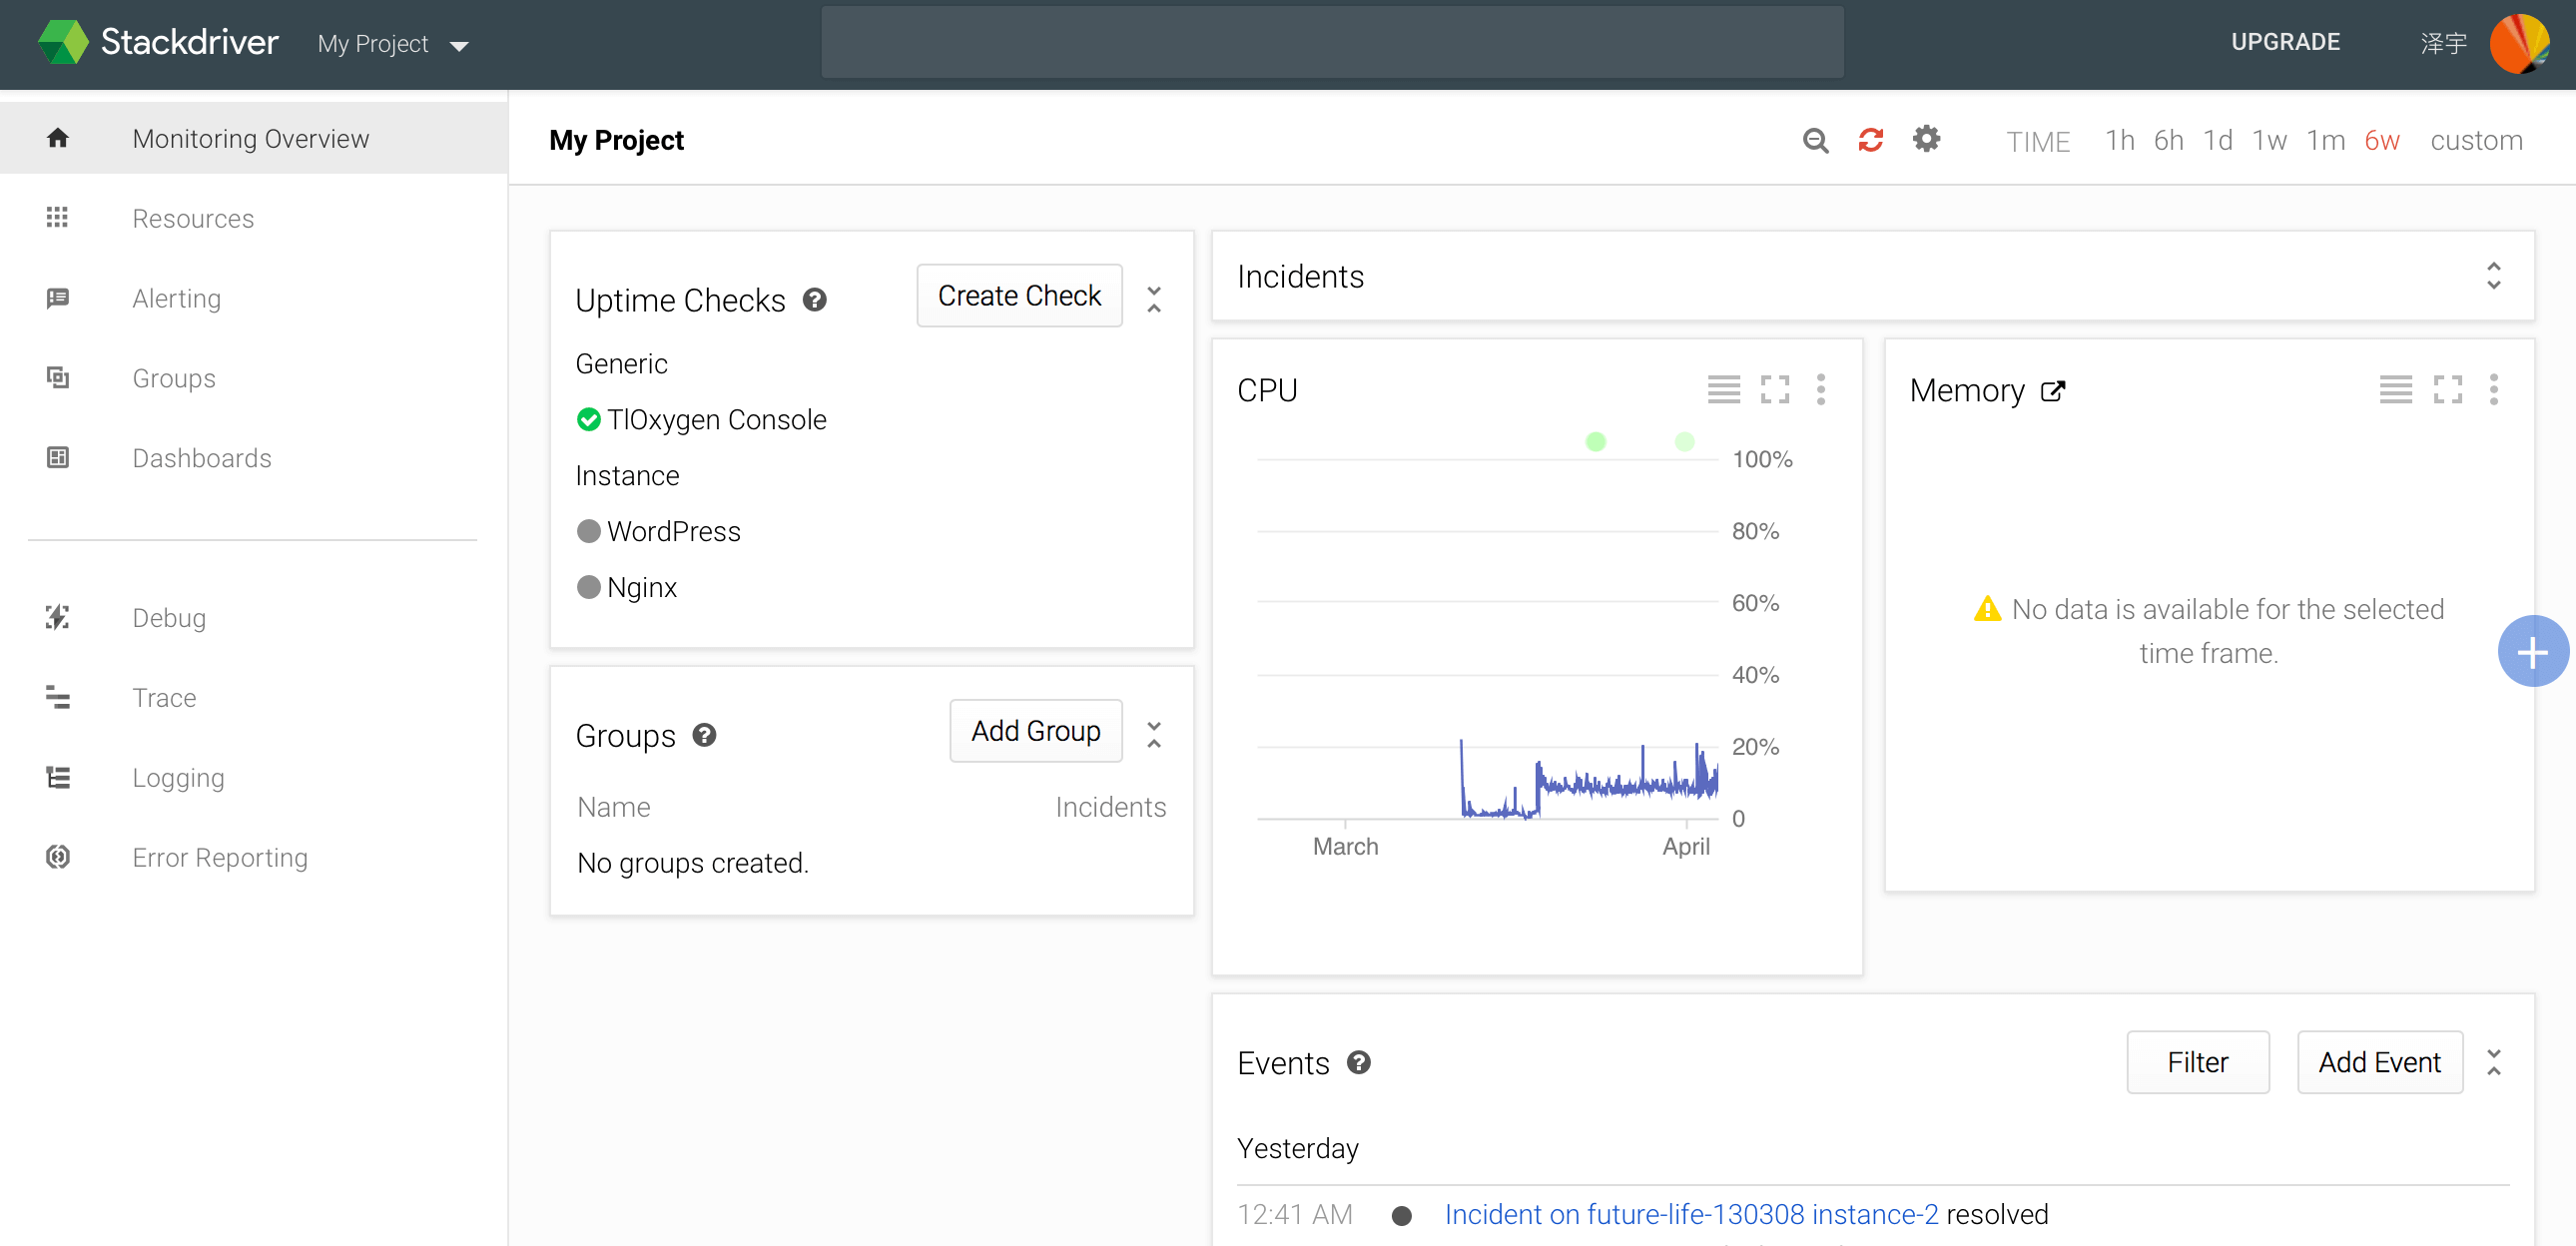
Finally, I’d like to introduce the powerful Stackdriver that I recently started using. Stackdriver is a server monitoring service under Google Cloud Platform (hereinafter referred to as GCP), which supports monitoring, debugging, tracing, and logging. Among them, Uptime Check supports HTTP(s) and TCP, and the shortest monitoring period is 1 minute. It supports E-mail, SMS and in-app alerts. Its Uptime Check is monitored from 6 regions around the world at the same time, and you can see the delay in each region. The speed used to detect the CDN would certainly be good.

If you are using Google Compute Engine (hereinafter referred to as GCE) or other GCP services, then this service can also record server logs for you, with a monthly allowance of 5 GB, and $0.5/GB for each extra. In addition, it can monitor server performance and monitor various indicators of the server. Although the original GCE panel can also provide information such as CPU, but this requires the installation of Agent on the server, so it can provide richer and more accurate information. The installation process is as follows:
1 | curl -O https://repo.stackdriver.com/stack-install.sh |
After all, it is Google’s own service, and installation does not require any login and other operations. Data is collected automatically after installation. It is divided into two parts. Stack Monitoring is used to monitor server metrics, including hard disk storage space, memory usage (including Used, Buffered) and other data that GCE cannot monitor by default. There is also Logging, which can automatically synchronize logs to Google’s cloud, and you can perform searches and other operations centrally. However, the Logging process will occupy about 100M of memory, and small memory instances should be used with caution. It should be noted that Only Logging is free, and Monitoring is charged at $8 per month. Then, you can also create an alert for a certain metric, like I created an email me when disk space is above 90%. It can create icons for public pages to share server metrics and Uptime Check delays, but it can’t show the online rate, which is really a strange design.
Observium
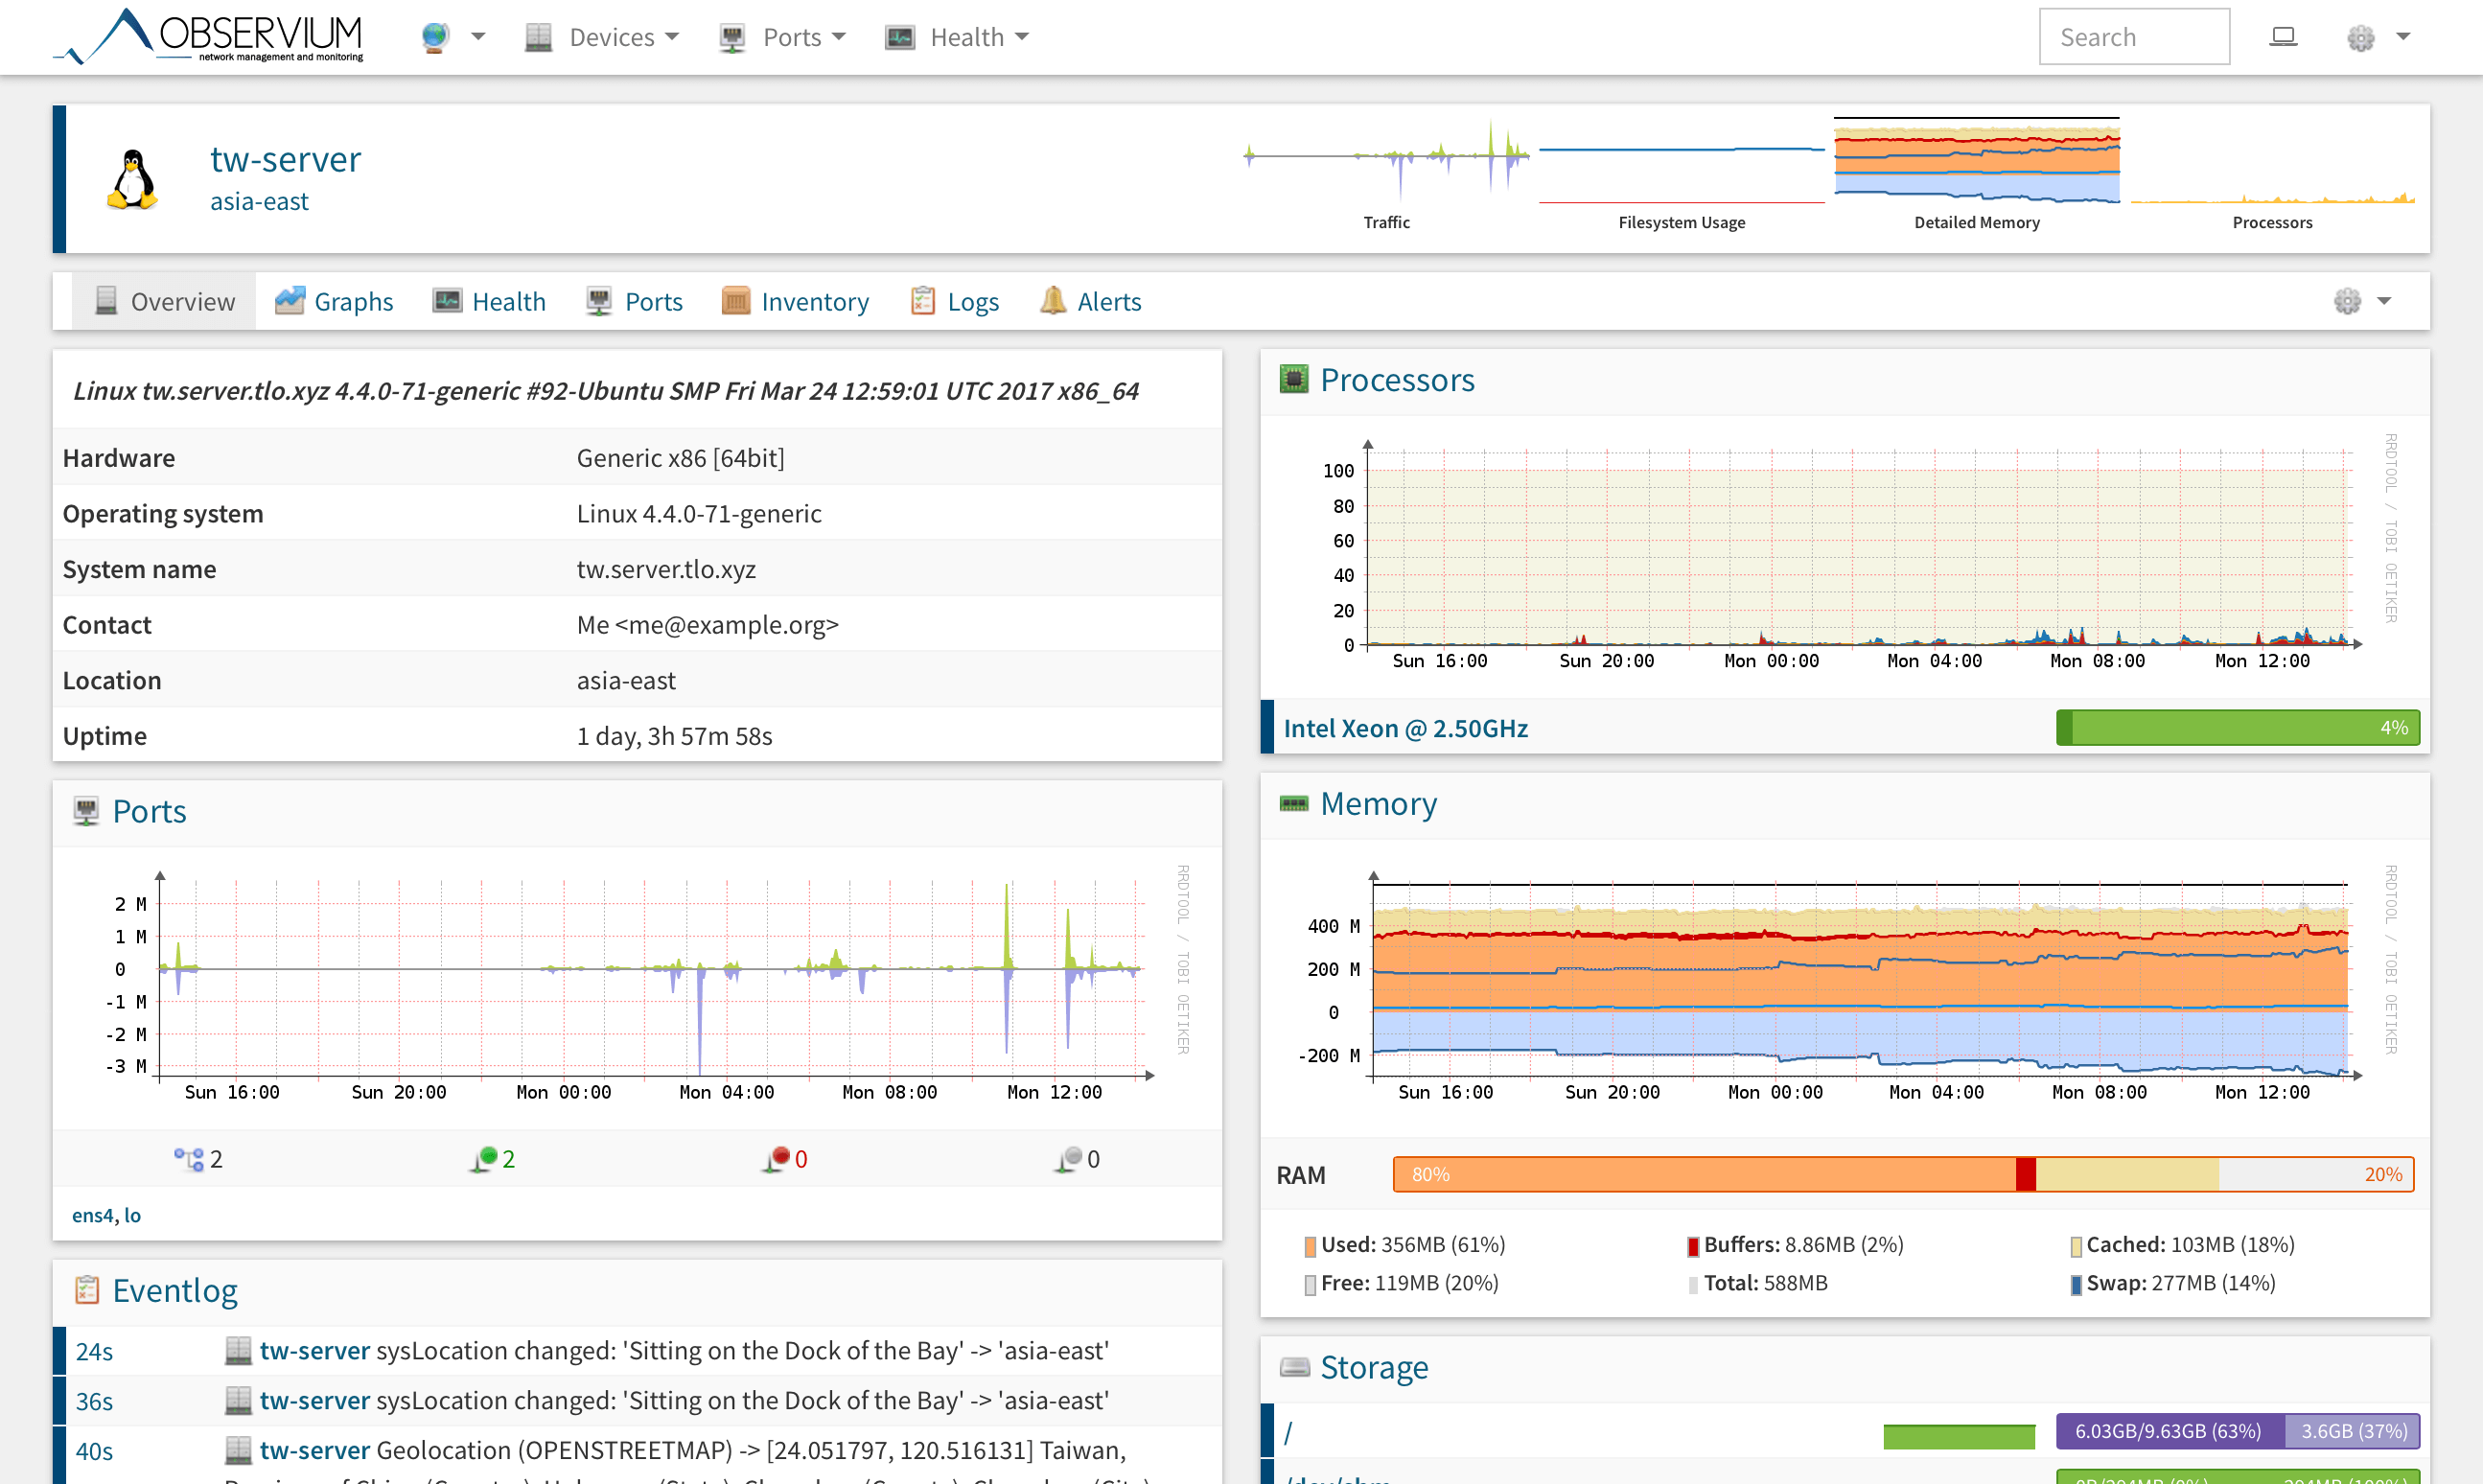
Observium can be used to monitor various indicators of the server through snmp, including memory, storage, network card, etc. It can be installed for free on its own server and requires MySQL and PHP environments. The official website gives an example of Apache. If you use Nginx, you do not need to install Apache.

It displays the chart by generating PNG on the server, so the chart is very beautiful and delicate, but because it is not a vector diagram, it is difficult to achieve real-time incremental update and cannot see the value at a certain moment in detail. Observium can easily manage many servers. You can experience the Online Demo.